
Vaccine Hesitancy in the UK
Israt Jahan
2 December 2021
University Of Edinburgh
Narrative
Target Audience:Our primary target audience for this study is the Black British community across the UK. We are specifically addressing individuals who have expressed hesitancy regarding COVID-19 immunisation. However, the findings and insights presented in this study are relevant and valuable to the general population of the UK who may have reservations about receiving the COVID-19 vaccine.
Data Source: The data utilised for this research was sourced from the John Hopkins data repository. We meticulously examined COVID-19 data pertaining to the United Kingdom, with a particular focus on various key metrics. These metrics encompass confirmed cases, the count of individuals who are fully vaccinated, those who are partially vaccinated, individuals who have recovered from the virus, and the case fatality ratio.
Type of Data: The data employed in this study falls under the category of categorical data. Categorical data is characterised by its division into distinct groups or categories, each of which represents specific attributes or variables. In our analysis, these categorical variables encompass confirmed cases, deaths, recoveries, individuals who have received full vaccination, and those who have received partial vaccination. It is important to note that while these categories may represent qualitative information, they are assigned numerical values for analytical purposes.
Maximum Value: The highest numerical value encountered in our dataset is 45,460,122. This value serves as a crucial reference point within our analysis, providing valuable context for the interpretation of the data.
Our study is directed towards addressing vaccine hesitancy within the Black British community in the UK, while also catering to a wider audience concerned about COVID-19 vaccination. The data we have utilised, sourced from John Hopkins, consists of categorical information that has been assigned numerical values to facilitate a comprehensive analysis, with the maximum value observed being 45,460,122.
Data Format: The data employed in this analysis is structured in Xls format, encompassing a time frame from January 2020 through 21st October 2021.
Objective for Target Audience: The primary objective of this data collection endeavour is to contribute to the reduction of COVID-19 mortality rates. Specifically, the intention is to provide influential insights that encourage individuals who may harbor vaccine hesitancy to reconsider and opt for vaccination.
Strengths of the Data: This dataset boasts several notable strengths, rendering it highly informative and valuable. Notably, it is exceptionally up-to-date, reflecting the most current circumstances. Its accuracy is underscored by its alignment with real-time data. Furthermore, it exhibits storytelling potential, serving as a compelling narrative of the ongoing COVID-19 pandemic. It is a testament to the collaborative abilities of our team, demonstrating effective teamwork. Moreover, it underscores our proficiency in problem-solving and reflects our innate curiosity about the ever-evolving global landscape.
Limitations: While this dataset presents a wealth of valuable information, it is essential to acknowledge its limitations. One notable limitation pertains to the Case Fatality Ratio (CFR) data, which may not provide a comprehensive representation of fatality risk in certain conditions. Additionally, successful data visualisation, machine learning outcomes, and data science solutions necessitate proficient programming. Debugging, a critical aspect of this process, is essential to ensure the seamless transition from data processing to final decision-making. During the analysis of country data, minimal errors were encountered. However, when processing the "country_COVID_19_vaccine_data," significant errors surfaced, primarily attributable to the presence of null data (designated as "NA"). These "NA" values necessitated removal to facilitate successful execution. Subsequently, a meticulous data cleaning process was conducted to eliminate errors and ensure data integrity.
Challenges and Resolutions:
- Programming Challenges: Initially, challenges were encountered in the R programming language, particularly with functions such as Ggplot and Tidyverse, stemming from coding errors. Guidance and support from our instructor, Mairead, were instrumental in overcoming these hurdles and achieving successful execution, particularly on the Mac platform.
- Code Execution for CFR: The calculation of the Case Fatality Ratio (CFR) required proficient coding in R. To enhance visual appeal, Tableau was utilised. This process demanded the provision of code generated during the tutorial, ensuring transparency and replicability in the analysis.
This dataset, though rich in information, is not without its constraints. However, its strengths, including timeliness and accuracy, position it as a valuable tool in influencing individuals to make informed decisions regarding COVID-19 vaccination, with a commitment to reducing mortality rates. Challenges faced during data analysis were diligently addressed, underscoring our dedication to producing robust and reliable data science solutions.
Data Story
The imperative of vaccination in combating the COVID-19 pandemic cannot be overstated. It serves as a powerful tool for reducing the mortality rate associated with this relentless virus. However, in the United Kingdom, a concerning trend has emerged as vaccine hesitancy has taken root, resulting in a decline in the number of individuals coming forward to receive the lifesaving vaccine.
Conveying the Problem
Data from UK vaccination programs has revealed that vaccine uptake has been notably more modest in regions with a larger proportion of minority ethnic communities. This presents a critical challenge: the risk of lower vaccine uptake within minority ethnic societies. This data underscores the pressing need to address vaccine hesitancy within these communities.
Lead Statement
The vaccine is a shield that protects lives, offering a potent defense against the relentless threat of COVID-19. As of the current data available, a substantial percentage of UK adults have received at least one dose of a COVID-19 immunization, ranging from 93.1% to 95.8%. Moreover, between 83.5% and 89.8% of adults have received at least two doses. However, despite these promising figures, a significant portion of the population remains hesitant to be immunized against COVID-19.
It is indisputable that higher vaccination rates correlate with a reduced mortality rate. Therefore, it is imperative to support those who remain undecided about vaccination, empowering them to protect themselves and their communities. This is especially critical among ethnic minority groups. Furthermore, socio-economic factors, knowledge gaps, misinformation propagated on the internet, and conspiracy theories have all contributed to vaccine hesitancy.
Our Target Audience
Our primary focus is on minority ethnic groups, with the aim of enhancing their understanding of the risks associated with contracting the virus while simultaneously emphasizing the efficacy of existing COVID-19 protection measures.
In-depth Insights
When we delve deeper into the data, a concerning pattern emerges: Black or Black British adults exhibit the highest rates of vaccine hesitancy, standing at 21%, in stark contrast to White adults at 4%. The primary reasons cited for vaccine hesitancy include concerns about potential side effects, apprehension about long-term health consequences, worries related to health protection, and the perceived impact on productivity.
Statistics of Vaccinations in the UK
As of 21st October, the vaccination statistics in the UK are as follows:
- At least one dose: Total 49,603,139, which accounts for 73% of the population.
- Fully vaccinated: Total 45,486,950, representing 67% of the population.
- Booster doses administered: 5,357,389, constituting 8.0% of the population.
A Call to Action
In light of these findings, it is imperative that we take action:
- Design comprehensive plans and strategies to influence and encourage vaccination among hesitant populations.
- Stay informed about the latest vaccination information provided by public health authorities.
- Compile a registry of individuals who remain unvaccinated.
- Develop a tailored approach to reach and persuade unvaccinated individuals, regardless of their circumstances.
our data narrative underscores the critical importance of addressing vaccine hesitancy, particularly within minority ethnic communities. It is a call to action to empower individuals with knowledge, dispel myths, and promote vaccination as a potent tool in our collective battle against COVID-19
Visual 1
The numeric number presented monthly population and CRF
Redline graph illustrated:
Month of Date: April 2020
Inc.People partially vaccinated: 0
Case fatality ratio (CFR): 0.1736
Month of Date: October 2021
Inc.People partially vaccinated: 681,800
Case fatality ratio (CFR): 0.0030
Green Bar chart presented:
Month of Date: April 2020
Inc.People partially vaccinated: 0
Inc.recovered: 1,002
Month of Date: October 2021
Inc.People partially vaccinated: 681,800
Yellow line graph presented
Month of Date: October 2021
Inc.People partially vaccinated: 681,800
The top blue bar chart displayed
Month of Date: September 2021
Inc.People fully vaccinated 2,076,788

Calculation Table -
% of the total (confirmed, People fully vaccinated, partially vaccinated and death ) along the month of date, a quarter of date, year of the date.
Death of previous year along the month of date, a quarter of date, year of the date.
Year by year along the year of the date, a quarter of date, the month of the date.
Calculation Table
Book 1 - Calculation Table
Click the link for view full Calculation Table
Book 2 - Vaccination Trend in the UK from 2020 January to 2021 October and CRF
Click the link for view full Vaccination Trend in the UK from 2020 January to 2021 October and CRF
Book3 - Covid 19 - UK Dashboard
Click the link for view full Dashboard
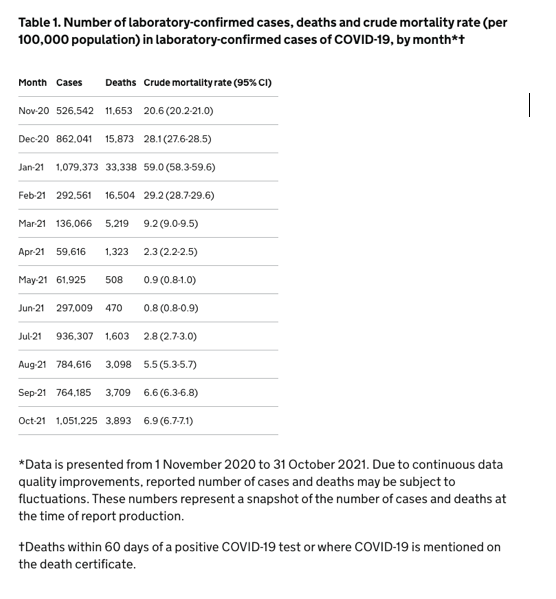
Statistics from UKHSA
COVID-19 fatality rates
Within the time 1 November 2020 to 31 October 2021, 6,851,466 cases of COVID-19 were identified in England. During the same time, therefore 97,191 mortality in persons with laboratory had been confirmed. this draws a raw fatality rate of 171.9 per 100,000 people. From 1 November 2020 onwards, the largest reported number of everyday mortality was 1,364 deaths approaching 19 January 2021.

In Reflection: Enhancing Individual Contributions
In hindsight, considering the path I have traversed while working independently, I find several areas where I could have refined and augmented my efforts. I believe these refinements would have significantly elevated my contributions, particularly in the domains of Tableau and R programming languages.
Tableau and R Proficiency: A Focus on Excellence
One key aspect I would have approached differently is dedicating even more extensive efforts to honing my proficiency in Tableau and R programming languages. These tools are invaluable for data analysis, visualisation, and presentation. My commitment to mastering these languages would have allowed me to produce more sophisticated and impactful data visualisations.
Statistical and Mathematical Analysis: Elevating Skill Sets
Furthermore, I recognise the significance of strengthening my skills in statistical and mathematical analysis. These competencies are fundamental in generating robust data visualisations and creating compelling presentation slides. With a deeper understanding of statistical principles, I could have delved into data with greater precision and insight, resulting in more informative and persuasive presentations.
In conclusion, my hindsight reflections lead me to acknowledge the potential for improvement in my individual contributions. A more dedicated focus on Tableau and R proficiency, coupled with an emphasis on enhancing statistical and mathematical analysis skills, would have allowed me to provide even more valuable insights and data-driven presentations. These insights will undoubtedly guide my future endeavours in data analysis and presentation.
Calculation Table
Book 1 - Calculation Table
Click the link for view full Calculation Table
Book 2 - Vaccination Trend in the UK from 2020 January to 2021 October and CRF
Click the link for view full Vaccination Trend
Click the link for view full Book3 -Covid-19 Dashboard
Click the link for view full Presentation Link
Visual 1 Clear take-home message as title
Vaccine Hesitancy in the UK
Redline graph showed
Month of Date: October 2021
Inc.People partially vaccinated: 681,800
Case fatality ratio (CFR): 0.0030
Green Bar chart presented:
Month of Date: October 2021
Inc.People partially vaccinated: 681,800
The top blue bar chart displayed
Month of Date: September 2021
Inc.People fully vaccinated: 2,076,788
Inc.People partially vaccinated: 787,006
Background Analysis
In examining the background data, a crucial issue emerges. The data reveals that Black or Black British adults exhibit the highest rates of vaccine hesitancy, standing at 21%, in stark contrast to White adults at 4%. The primary reasons cited for declining vaccination include concerns related to side effects, apprehensions about long-term health effects, safety concerns, and worries regarding potential effects on fertility. This data underscores the complex challenge of vaccine hesitancy within the UK population.
Choice of Graphs
To effectively communicate this critical data, various graph types have been employed, each chosen for its specific strengths and suitability:
- Line Graphs: Line graphs are employed to trace changes over time, especially when smaller variances exist. They offer a clear representation of trends and are particularly useful for illustrating data with temporal significance.
- Bar Charts/Graphs: Bar charts are used to visualize data that has subgroups requiring differentiation. Each subgroup is distinctly represented, making it easy to compare and contrast.
- Dual-Axis Charts: Dual-axis charts are utilised to overlay two distinct graphs on a shared horizontal axis, often with varying vertical axis scales. This technique allows for the presentation of a direct relationship between two sets of vertical conditions, enhancing the clarity of data representation.
- Area Charts: Area charts provide a visually appealing way to represent data, particularly when showing the cumulative effect of multiple data series over time.
- Forecast Charts: Forecast charts are instrumental in projecting future trends based on historical data, offering valuable insights into potential outcomes.
Explanation of Decision-Making Process
In the process of data analysis, various techniques and tools were employed to create compelling visualisations and narratives. Notably, the following approaches were utilised:
- R Programming and ggplot2: The R programming language, in conjunction with ggplot2, was leveraged to create data visualisations. This combination allowed for a high degree of customisation and creativity in chart design.
- Tableau: Tableau was explored to enhance data visualisation capabilities. It provided a user-friendly platform for creating dynamic and interactive dashboards.
- Data Manipulation Libraries: Libraries such as Dplyr and Tidyr were employed to clean and manipulate data effectively, ensuring the accuracy and reliability of visualisations.
- Mathematics and Statistical Analysis: Mathematical calculations and statistical analysis were integral in generating accurate visual representations of data, offering deeper insights into the trends and patterns observed.
Team Contributions and Interactions:
The project was a collaborative effort led by (To), with valuable contributions from team members (A M), (M K) and (S P). The team engaged in extensive discussions, brainstorming ideas, and collectively contributed to narrative development. Their diverse skills, including data analysis and IT proficiency, were instrumental in crafting a comprehensive and informative data story.
In conclusion, the chosen graph types and data analysis techniques were carefully considered to effectively convey the complexities of vaccine hesitancy. The collaborative efforts of the team played a pivotal role in bringing this narrative to life, with each member contributing their expertise to create a compelling and informative data story.
Peer and Tutor Feedback Reflection:
During the course of the project, valuable feedback was received from both peers and our teacher Mairead Birmingham. These insights provided diverse perspectives and helped refine our approach:
Critical Reflection:
In response to the feedback received, critical reflection led to several key considerations:
- Data Details: Mairead's feedback underscored the importance of providing comprehensive data details. We recognized the need to offer a deeper understanding of data sources, formats, types, and essential statistical measures to enhance the overall quality of our project.
- Addressing Concerns: Joseph Limeta's concerns regarding vaccine-hesitant groups prompted us to revisit our approach. We explored strategies to address the specific challenges faced by this demographic and sought to tailor our narrative accordingly.
- Data-Driven Approach: Sidhant Seth's inquiry about countering false beliefs on vaccine side effects through a data-driven approach initiated discussions on the use of data to combat misinformation and enhance vaccine education efforts.
Development of Skills:
The group project provided a fertile ground for the development of essential skills, including data science, collaboration, teamwork, and communication. Leveraging the Edinburgh server, Learn, and other collaborative tools, our team seamlessly interacted through live video, content sharing, messaging platforms, and regular communication via WhatsApp. These experiences enriched our collaborative abilities and honed our data science skills, equipping us for future endeavours in this dynamic field.
In summary, the feedback received from peers and our tutor proved instrumental in refining our project approach. These insights catalysed critical reflection, leading to enhanced data presentation and narrative crafting. Moreover, our collaborative experiences fostered the growth of valuable skills, preparing us for future challenges in the realm of data science and beyond.
----------------------------------------------------------------------------------------------------------------------------------------------------------------------
MORE POST YOU MAY LIKE
1) Privacy Concerns About Children's Using Character.AI
2) AI-Powered Fraud Detection for inventory management software
3) COVID-19 Vaccine Hesitancy in the UK (presentation slide)
5) AUTONOMOUS LIGHT FINDER Robot (Assignment)
6) Ai Finance: Artificial Intelligence Finance Solutions
7) AI Ethics & Laws: Privacy Insights: Types of Personal Information Monitored by ChatGPT
8) AI Finance: 12 Kind Of Robot Will Elevate Your Financial Game
9) Vaccine Hesitancy in the UK
10) The Most Significant Concerns with AI Finance
12) 5 Minutes in The AI Thought Chamber
13) The Story Behind University of Bedfordshire's Poster Day
14) Machine Learning Approaches in Cancer Research
15) Machine Learning-Based Biomedical Segmentation Algorithm
16) Cancer Research Image Classification: Exploring Machine Learning Techniques
Comments
Post a Comment